Disclaimer: when it comes to trading, it’s important to be moderate and accurate. Don’t think of it as a guaranteed way to make money — at least in the very beginning of your journey. The material below isn’t meant to promote anything, as it’s made purely for study purposes.
Page Contents
What is a Japanese Candlestick?
Source: blackwellglobal.com
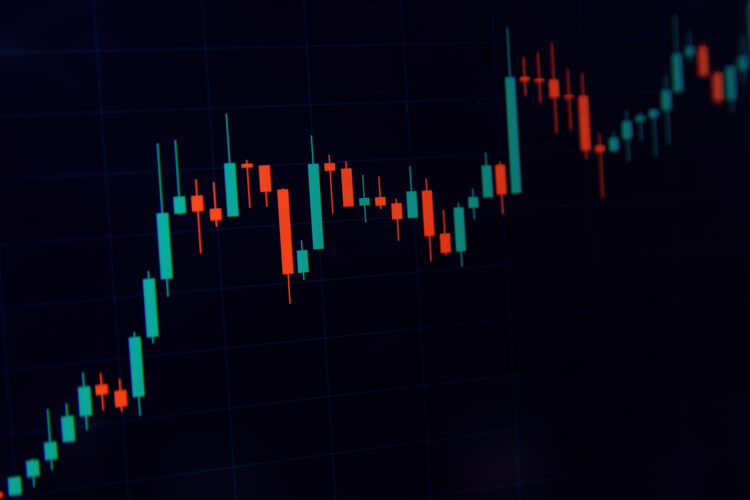
Japanese Candlesticks are one of the most useful things you can look at on a chart. They show the lowest and highest prices over a certain time period.
They were invented by Honma Munehisa, just a regular rice merchant, who introduced them into his workflow to make his own work easier.
They’ve since been recognized all over the Globe.
But why are they considered so useful anyway?
Well, the thing is that they show the moods present in the market in a particular time-frame. Read on, and we’ll tell you all the essentials; and a little more about Japanese Candlesticks.
What are Japanese Candles Made of?
There are three main elements:
- The body.
- The shadow (or a wick).
- The time-frame.
Let’s take a closer look at each one.
The Body
Source: investingoal.com
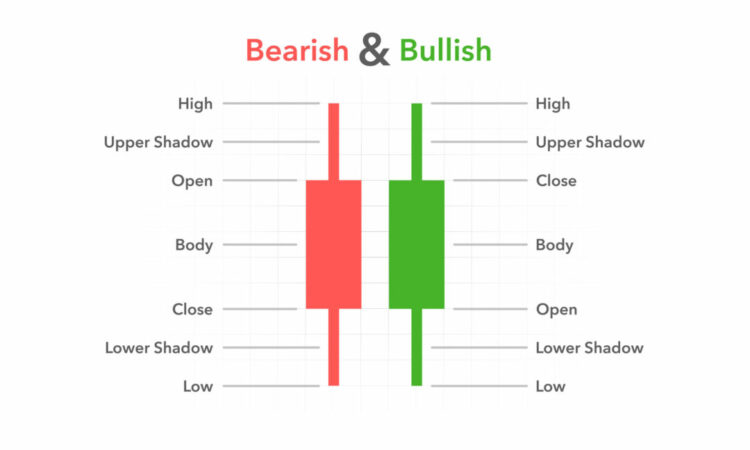
The body is a rectangle “thing” that’s either red (for a negative, so-called bearish price trend) or green (for a positive, so-called bullish price trend).
Sometimes, though, the multicolored “interpretation” is replaced by a black and white one.
In this case, the price of an asset that’s on the rise is shown with a bright figure, while the price of an asset that’s on the decline is shown with a darker one.
But it’s not just the color that matters.
The borders of this very rectangle are important, too. Thus, the lower and upper ones show the price of the asset at the start or end.
Do remember to take the body length into your forecasts as well.
Like if it’s longer, that means the price has changed more during the trades.
And if it’s shorter, that indicates that the price change is not that significant during the same given period.
The Shadow
The shadows we’re talking about are the lines that go across the top and bottom of the body. The top of the line shows the highest price the asset has reached, while the bottom shows the lowest.
The longer the wick, the stronger the trend.
The gist of it is pretty straightforward.
As an aside, there are candles without shadows whatsoever.
They’re called “Marubuzo.” These are some pretty powerful iterations.
What that means is that the trend is absolutely on a one-hundred-percent trajectory, with no fluctuations in either direction. Zero volatility.
The Time-Frame
The time-frame is the amount of time that the candle is formed.
It can be pretty of any length: a minute, an hour, a day, a week.
Even a year.
Understanding Japanese Candlesticks — Reading the Patterns
Source: libertex.com
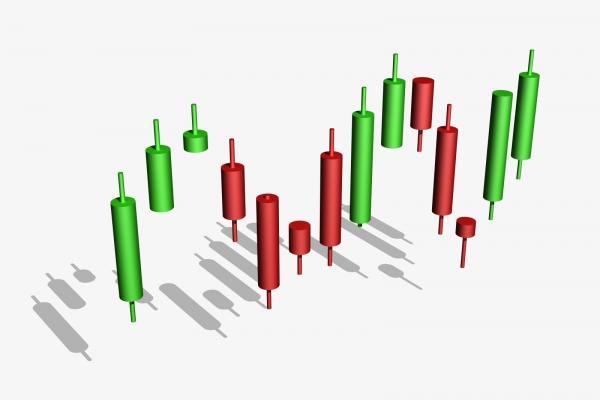
Here are some of the most recognizable patterns.
Hammer
The hammer is a pivot piece.
It can either have a small shadow at the top (just a sole shadow and nothing more), or it can have no shadow there, yet have a pretty distinct one right at the bottom place.
Also, the hammer is necessarily a formation of bullish signs.
This means that when you spot a hammer, it makes sense to go for the asset.
Sure do, before proceeding, first look for confirmation from the next candles.
And if all is well, consider buying.
Inverted Hammer
An inverted hammer is a pivot piece as well. But in another way.
It can be with a very short or no shadow at all.
It can be with a small body and a long shadow on top.
Either way, we’re talking about a bearish figure, which signals a price decline. So, it makes sense to refrain from buying the asset.
Bullish Engulfing
In a nutshell, it’s a sign that the downward trend is continuing.
If this pattern shows up with the second candle completely covering the first, it might be a good time to buy.
Bearish Engulfing
In a nutshell (yes, as well), it’s a sign that the upward trend is continuing.
If this pattern shows up with the second candle completely covering the first, it might be a good time to buy.
Doji
Source: digiteckworlds.wordpress.com
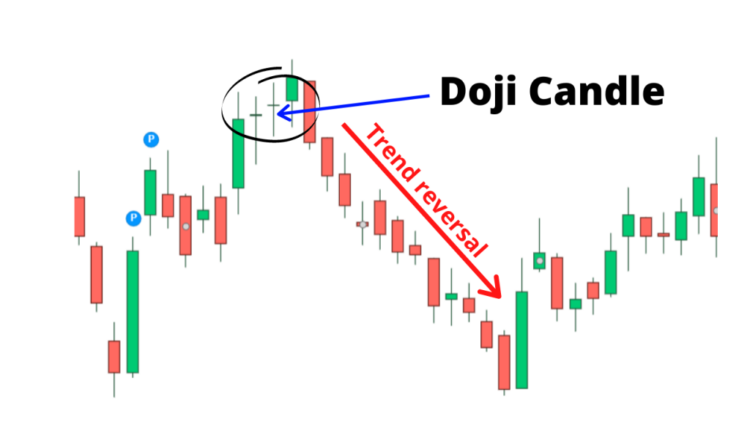
Another common pattern is the Doji.
It has a narrow body, which basically means that the opening and closing prices are the same.
Or they’re pretty similar in their movements.
As a general rule, the Doji pattern is the most neutral one you can find. Sure thing, if it happens alongside with other candlesticks that have long bodies, one can assume a trend reversal.
But to be fair, this doesn’t happen very often.
Japanese Candlesticks & Technical Analysis — the Meaning
It’s fair to say that almost all technical analysis techniques are based on Japanese Candlestick theory.
In one way or another.
The truth is, you don’t need to master every single detail to trade successfully. The key is being able to recognize price patterns and identify signals that indicate whether a trend is strengthening or weakening. To make this process easier and more efficient, consider using tools like MyIndicators technical indicators, which can help you quickly spot and analyze patterns with greater accuracy.
And, of course, it’s important not to use patterns in isolation from the chart — a pattern that’s been shown is useless if it’s not backed up by lots of other evidence. In most cases, it’s better to wait for a clear confirmation by watching how the next candles behave.
And don’t forget about time-frames: it’s important to use a variety of them because otherwise you won’t get a complete picture. As an alternative, you can use larger time-frames (day, week, month) to analyze market trends and look for the entry point on smaller ones.
But you definitely shouldn’t base long-term trend conclusions on minute charts.
Just forget about that.
Conclusion
In sum, learning the ins and outs of Japanese Candlesticks patterns is key to success in trading. It can be somewhat challenging for beginners, though. So, it’s a rather good idea to use ready-made indicators to make it easier to recognize some of the patterns.

